
Our results for 2025/26
We’ve made good progress this year. We are completing more repairs and doing them faster.
We are also replying to complaints more quickly.
We know there's still more to do, and we are working hard to put our customers’ needs first.
We are spending more money on our homes and communities, ensuring that they are safe and in good condition.
More customers are telling us what they think about our services. We use this feedback to make things better. This includes:
- being clearer in how we communicate
- taking responsibility for what we do
- making changes that improve your experience
This page shows how our housing services in England performed in 2025/26, including Supported Living.
Full details of our performance can be found in the 2025/2026 and 2024/2025 results tables below.

What is a Tenant Satisfaction Measure?
We are measured against 22 standards set by the Regulator of Social Housing (RSH). Twelve of these come from customer surveys. They tell us what customers think about our services. The other 10 come from the information we collect about how our services run.
The measures cover two groups:
- people who rent their home
- people who own their home (leaseholders and shared owners)
We group the measures into six themes:
- Overall satisfaction
- Keeping homes in good repair
- Making sure buildings are safe
- Being respectful and helpful
- Looking after neighbourhoods
- Handling complaints well
Not every measure applies to both renters and owners. But together, they show how people feel about Sanctuary and our services.
1. Overall satisfaction

62.8% (tenants)
TP01: Proportion of respondents who report that they are satisfied with the overall service from their landlord.

46.3% (owners)
TP01: Proportion of respondents who report that they are satisfied with the overall service from their landlord.
Our results are similar to last year.
We have made improvements to our services. But it can take time for these changes to be felt by residents.
You told us that clear communication and getting things right first time matter most, especially for repairs. We have taken steps to keep you better informed and provide a more reliable service.
We have a clear plan to improve our services. This includes making changes to how we work, using better technology, and listening more to customers.
This is starting to make a difference. But we know we still need to do more to communicate clearly and provide a consistent service you can rely on.
We hope to see more of this progress in our 2026/27 results.

2. Keeping properties in good repair

65.2% (tenants)
TP02: Proportion of respondents who have received a repair in the last 12 months who report that they are satisfied with the overall repairs service.

57.5% (tenants)
TP03: Proportion of respondents who have received a repair in the last 12 months who report that they are satisfied with the time taken to complete their most recent repair.
We’re completing more repairs more quickly. We’re also working hard to get more repairs right first time and keep you informed at every stage of your fix. We’ve tightened our target for completing non-emergency repairs to 30 working days in 2026/27. This is a significant change from 45 days previously.
These results don’t include homeowners, as they are responsible for their own repairs.

0.2%
(RP01) Proportion of homes that do not meet the Decent Homes Standard.

81.5%
(RP02) Proportion of non-emergency responsive repairs completed within the landlord’s target timescale.

93.0%
(RP02) Proportion of emergency responsive repairs completed within the landlord’s target timescale.

64.6% (tenants)
TP04: Proportion of respondents who report that they are satisfied that their home is well maintained.

73.4% (tenants)
TP05: Proportion of respondents who report that they are satisfied that their home is safe.

68.6% (owners)
TP05: Proportion of respondents who report that they are satisfied that their home is safe.
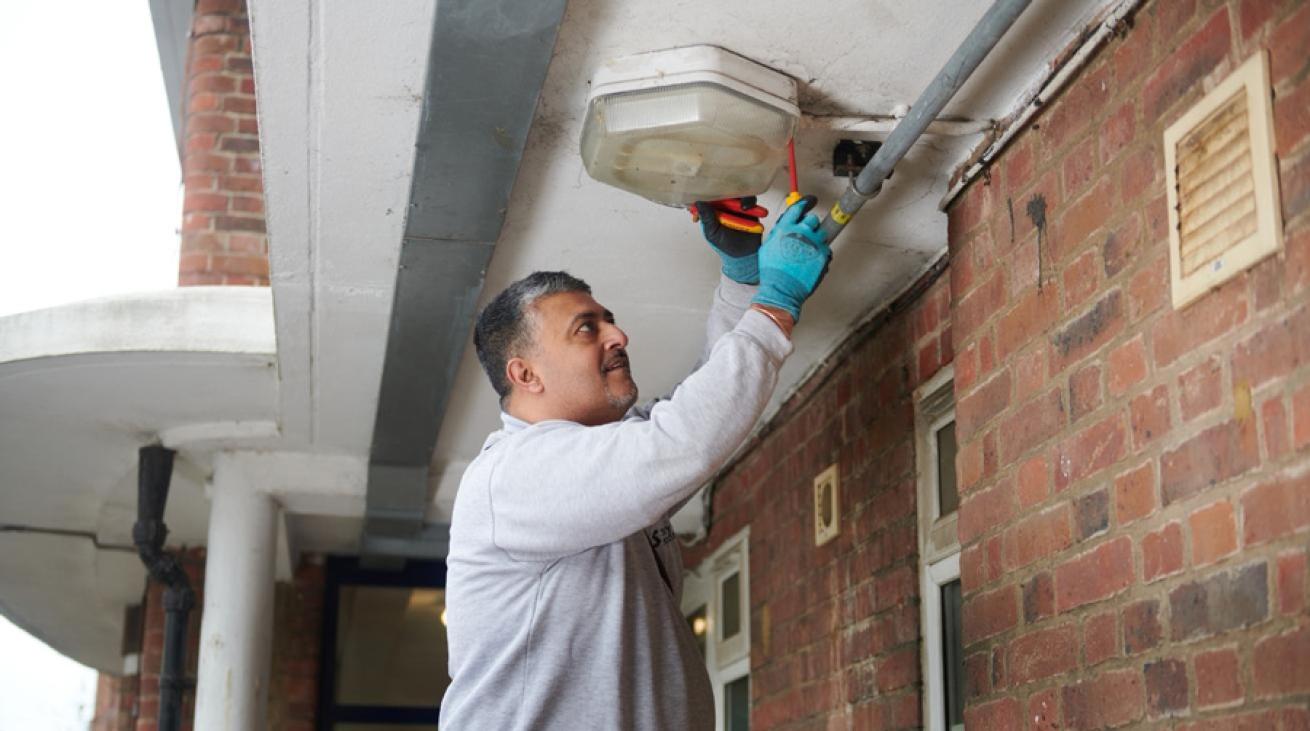
Keeping you safe in your home is the most important thing we do.
Most residents told us they feel their home is well maintained and safe. We aim to complete all safety checks on time and achieved 100% for fire risk assessments, water hygiene and asbestos surveys.

99.8%
(BS01) Proportion of homes for which all required gas safety checks have been carried out.

100%
(BS02) Proportion of homes for which all required fire risk assessments have been carried out.

100%
(BS03) Proportion of homes for which all required asbestos management surveys or re-inspections have been carried out.

100%
(BS04) Proportion of homes for which all required legionella risk assessments have been carried out.

98.4%
(BS05) Proportion of homes for which all required communal passenger lift safety checks have been carried out.
4. Respectful and helpful engagement

53.7% (tenants)
35.5% (owners)
TP06: Proportion of respondents who report that they are satisfied that their landlord listens to tenant views and acts upon them.

63.4% (tenants)
52.6% (owners)
TP07: Proportion of respondents who report that they are satisfied that their landlord keeps them informed about things that matter to them.

75.2% (tenants)
58.5% (owners)
TP08: Proportion of respondents who report that they agree their landlord treats them fairly and with respect.
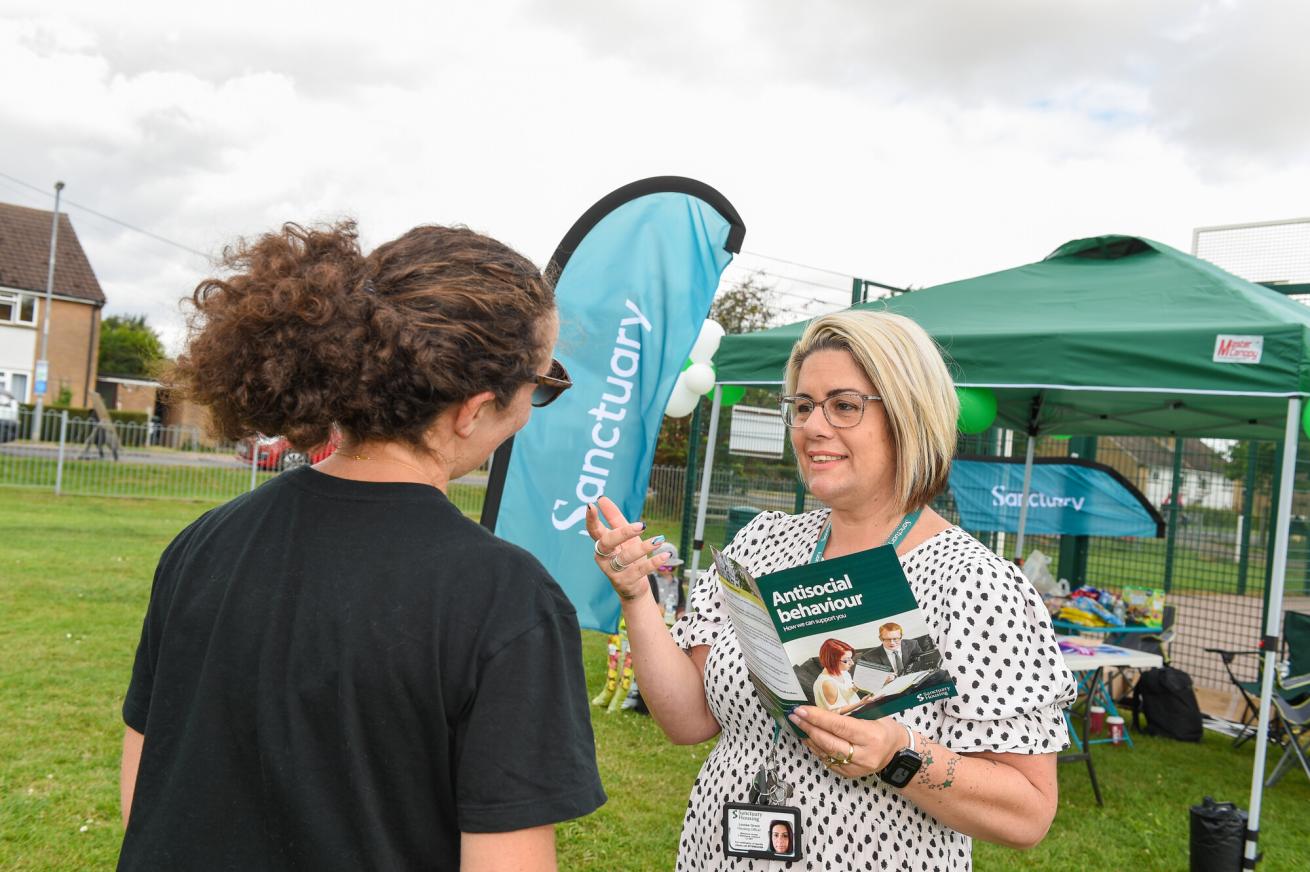
Most tenants told us we keep them informed about the things that matter to them. Around three in four tenants said we treat them fairly and with respect. We are giving customers more ways to tell us about their experience. This helps us focus on what matters most to you.
Over the past year, more than 42,000 customers shared feedback with us. Most comments were about their experience with our Customer Hub and Repairs teams.
We know clear and quick communication is important. We are working to improve this so you feel supported and confident in our service.
5. Effective handling of complaints
30.4% (tenants)
TP09: Proportion of respondents who report making a complaint in the last 12 months who are satisfied with their landlord’s approach to complaints handling.

24.1% (owners)
TP09: Proportion of respondents who report making a complaint in the last 12 months who are satisfied with their landlord’s approach to complaints handling.
We are responding to complaints faster and meeting more of the Housing Ombudsman’s timescales.
While some customers are satisfied with how we handle complaints, we know this is not where it needs to be. We need to listen better, communicate clearly and resolve issues more consistently.

124.7 (tenants)
52.3 (owners)
(CH01) Number of stage one complaints received per 1,000 homes

28.8 (tenants)
16.3 (owners)
(CH01) Number of stage two complaints received per 1,000 homes
95.1% (tenants)
90.0% (owners)
(CH02) Proportion of stage one complaints responded to within the Housing Ombudsman’s Complaint Handling Code timescales
97.0% (tenants)
98.6% (owners)
(CH02) Proportion of stage two complaints responded to within the Housing Ombudsman’s Complaint Handling Code timescales
6. Responsible neighbourhood management

70.2% (tenants)
48.2% (owners)
TP10: Proportion of respondents with communal areas who report that they are satisfied that their landlord keeps communal areas clean and well maintained.

57.9% (tenants)
41.2% (owners)
TP11: Proportion of respondents who report that they are satisfied that their landlord makes a positive contribution to the neighbourhood.
57.9% (tenants)
40.5% (owners)
TP12: Proportion of respondents who report that they are satisfied with their landlord’s approach to handling anti-social behaviour.
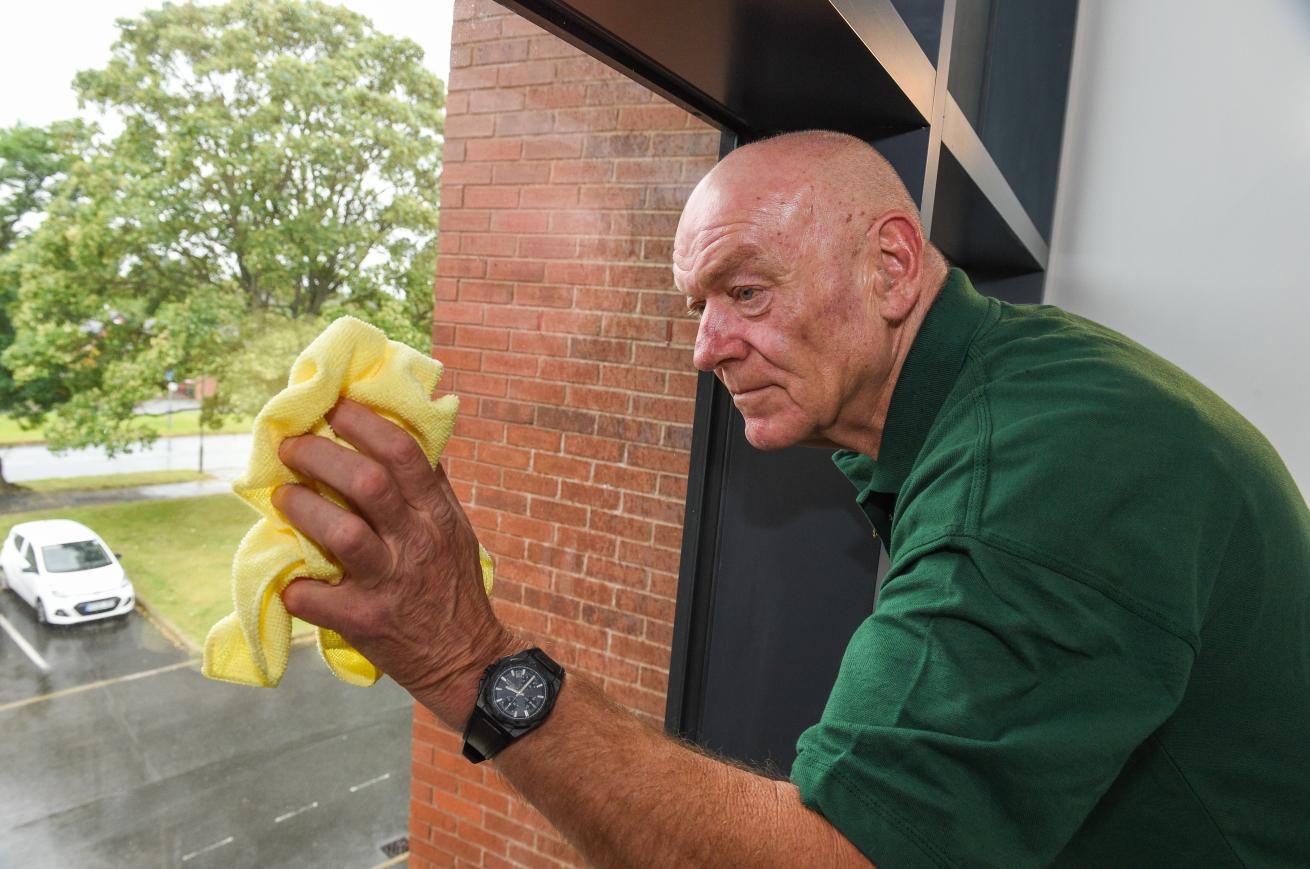
Fewer neighbourhood incidents were reported this year, which suggests we’re supporting communities more effectively. We know there is room for improvement.
We want everyone to feel safe, supported and confident in how we manage neighbourhood issues.
We’re reviewing our approach and working more closely with you to improve outcomes.

32.1
(NM01) Number of antisocial behaviour cases opened per 1,000 homes.

0.4
(NM01) Number of antisocial behaviour cases that involve hate incidents opened per 1,000 homes.