
Our results for 2024-25
Since we published our first Tenant Satisfaction Measures results in 2024, we’ve changed how we work to make things better for our customers. This has led to improvements in our repair service, complaint handling and how we keep our homes safe.
Our customer perception results have dipped a bit, but not significantly. We know we don’t always get it right and we have more to do to improve your experience with Sanctuary. Keeping you better informed on the progress of your repair and when you raise a complaint are both areas we need to improve.
This page shows how our Housing services in England, including Supported Living, performed during 2024/2025.

What’s a Tenant Satisfaction Measure?
Tenant Satisfaction Measures tell us how well we perform on the things most important to you. They cover two categories: Low-Cost Rented Accommodation (those who rent), and Low-Cost Homeownership (leaseholders and shared owners).
We’re scored against 22 Tenant Satisfaction Measures and report our results to the Regulator of Social Housing. Twelve of the measures are based on resident perception, telling us what customers think of our services. The remaining 10 measures are based on ‘management information’ collected across our operations.
Our Tenant Satisfaction Measure results help us hear our customer voice and we use them to learn and improve.
What we are measuring
We’ve grouped the measures under the six themes set out below. Some measures have separate results for Low-Cost Rented accommodation and Low-Cost Homeownership, as required by the Regulator of Social Housing.
- Overall satisfaction
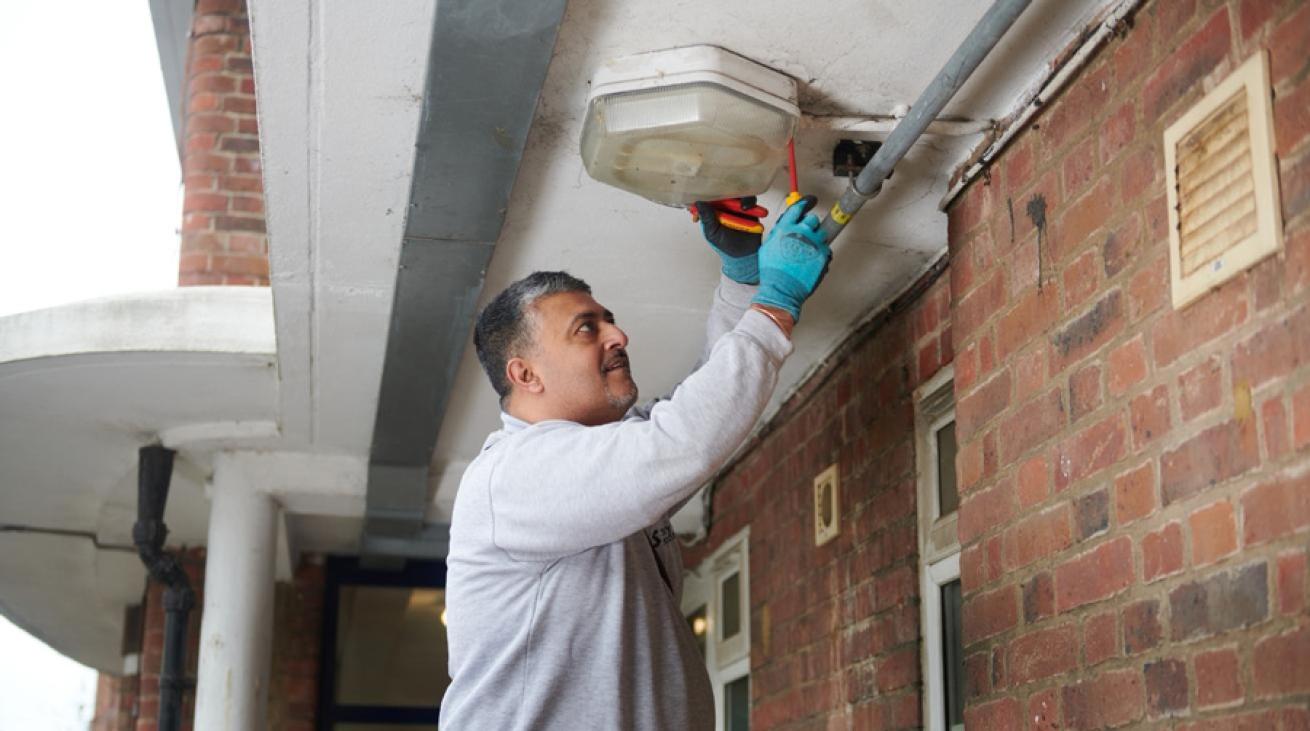
- Keeping properties in good repair
- Maintaining building safety and safety checks
- Respectful and helpful engagement
- Responsible neighbourhood management
- Effective handling of complaints
1. Overall satisfaction
63.9% (tenants)
TP01: Proportion of respondents who report that they are satisfied with the overall service from their landlord.
50.4% (owners)
TP01: Proportion of respondents who report that they are satisfied with the overall service from their landlord.
Our overall satisfaction scores aren’t where we’d like them to be, but we’re committed to improving our services. We’ve been making changes to the way we work, acting on customer feedback and listening to what matters most to you.
You told us that you want us to keep you better informed on the progress of repairs. We’ve listened to your feedback and invested heavily into new technology that enables us to keep you informed on every step of the repair process.
This change is not a short-term fix but a long-term improvement that will benefit every Sanctuary customer for years to come.
We will continue to roll out changes which improve the service we provide to both tenants and homeowners.

2. Keeping properties in good repair
66.5% (tenants)
TP02: Proportion of respondents who have received a repair in the last 12 months who report that they are satisfied with the overall repairs service.
58.8% (tenants)
TP03: Proportion of respondents who have received a repair in the last 12 months who report that they are satisfied with the time taken to complete their most recent repair.
We are focused on completing repairs more quickly and getting things right on our first visit to your home, while also keeping you better informed throughout the repair process.
The five ‘repair’ measures shown in this section do not apply to owners, who are responsible for repairing their own home.
0.2%
(RP01) Proportion of homes that do not meet the Decent Homes Standard.
69.6%
(RP02) Proportion of non-emergency responsive repairs completed within the landlord’s target timescale.
89.4%
(RP02) Proportion of emergency responsive repairs completed within the landlord’s target timescale.
3. Maintaining building safety and safety checks
66.2% (tenants)
TP04: Proportion of respondents who report that they are satisfied that their home is well maintained.
73.1% (tenants)
TP05: Proportion of respondents who report that they are satisfied that their home is safe.
76.6% (owners)
TP05: Proportion of respondents who report that they are satisfied that their home is safe.
Keeping you safe in your home is the most important thing we do. Around three in four residents surveyed thought their home was safe, while two thirds of tenants thought their home was well maintained. We aim to complete 100% of safety checks on time. We’re occasionally unable to access someone’s home to carry out a check, which can have a small impact on the figures we report.
99.7%
(BS01) Proportion of homes for which all required gas safety checks have been carried out.
99.9%
(BS02) Proportion of homes for which all required fire risk assessments have been carried out.
99.3%
(BS03) Proportion of homes for which all required asbestos management surveys or re-inspections have been carried out.
100%
(BS04) Proportion of homes for which all required legionella risk assessments have been carried out.
97.7%
(BS05) Proportion of homes for which all required communal passenger lift safety checks have been carried out.
4. Respectful and helpful engagement
53.5% (tenants)
36.3% (owners)
TP06: Proportion of respondents who report that they are satisfied that their landlord listens to tenant views and acts upon them.
62.7% (tenants)
54.4% (owners)
TP07: Proportion of respondents who report that they are satisfied that their landlord keeps them informed about things that matter to them.
74.0% (tenants)
63.7% (owners)
TP08: Proportion of respondents who report that they agree their landlord treats them fairly and with respect.
More than three in five tenants felt we kept them informed about things that matter to them. For shared owners, this figure was more than half. Almost three in every four rented customers felt we treated them fairly and with respect. Two-thirds of shared owners felt the same.
We know keeping you informed is very important to you and something we need to get better at.

5. Responsible neighbourhood management
67.5% (tenants)
52.6% (owners)
TP10: Proportion of respondents with communal areas who report that they are satisfied that their landlord keeps communal areas clean and well maintained.
56.3% (tenants)
41.5% (owners)
TP11: Proportion of respondents who report that they are satisfied that their landlord makes a positive contribution to the neighbourhood.
56.9% (tenants)
46.1% (owners)
TP12: Proportion of respondents who report that they are satisfied with their landlord’s approach to handling anti-social behaviour.
More than half of our rented customers surveyed felt that Sanctuary makes a positive contribution to their neighbourhood. Two in every three tenants were satisfied that their communal areas were clean and well maintained.
Our teams continued to support residents experiencing antisocial behaviour and hate incidents. We are pleased to report the number of incidents reported dropped last year.
All three satisfaction scores were lower for our shared owners, highlighting our need to review our approach for these customers.
56.4
(NM01) Number of anti-social behaviour cases opened per 1,000 homes.
0.6
(NM01) Number of anti-social behaviour cases that involve hate incidents opened per 1,000 homes.
6. Effective handling of complaints
29.7% (tenants)
TP09: Proportion of respondents who report making a complaint in the last 12 months who are satisfied with their landlord’s approach to complaints handling.
24.3% (owners)
TP09: Proportion of respondents who report making a complaint in the last 12 months who are satisfied with their landlord’s approach to complaints handling.
We’ve made a lot of progress in responding to complaints faster and meeting Housing Ombudsman targets.
For Stage 2 complaints, where we need to carry out a detailed investigation in each case, we improved the number of complaints we responded to on time by more than 15 percent more on time this year for our rented customers.
When things go wrong our safety net is our complaints process. We’re committed to learning from all complaints and making things right. In line with other landlords, about three in every ten tenants and almost a quarter of homeowners said they were satisfied with our approach to handling complaints during 2024/2025. This is not good enough and we are looking at how we can improve our approach.
114.0 (tenants)
57.7 (owners)
(CH01) Number of stage one complaints received per 1,000 homes
23.3 (tenants)
18.5 (owners)
(CH01) Number of stage two complaints received per 1,000 homes
92.5% (tenants)
84.7% (owners)
(CH02) Proportion of stage one complaints responded to within the Housing Ombudsman’s Complaint Handling Code timescales
79.6% (tenants)
86.0% (owners)
(CH02) Proportion of stage two complaints responded to within the Housing Ombudsman’s Complaint Handling Code timescales